Reducing Rebalancing Timing Risk with Tranching
Introduction
Rebalance timing plays a big role in medium- to long-term strategies that don’t trade often. Shifting the execution day by just a few days can meaningfully impact performance, changing the exact positions held, and affecting returns, volatility, and drawdowns.
This issue is often referred to as rebalance timing luck: the variation in performance that comes purely from the day you happen to rebalance, even when the strategy and signals stay the same.
Others have explored this too. Newfound Research wrote a great piece highlighting how impactful this effect can be. And the Concretum Group analyzed it in a GTAA context, showing that spreading rebalances out over time, instead of doing it all at once, can reduce timing risk and even lower turnover.
That got me curious: how much does timing luck affect my own long-short strategy? And could a more gradual rebalancing approach make it more stable, without changing the core logic?
Setup
The strategy is a long-short market-neutral model based on LightGBM predictions (see this earlier post). It rebalances every three weeks, with the entire portfolio updated on a fixed weekday at the closing price. Since there are three possible starting weeks (offsets) and five weekdays, that gives us 15 possible rebalancing schedules.
I simulate all 15 combinations:
- 3 offsets × 5 weekdays = 15 setups
- Each uses the same trained model and applies predictions available on that specific day
- Signals, logic, and universe stay exactly the same
Then, I compare this to a tranching setup, a common approach where the portfolio is divided into parts and rebalanced gradually. Here, the portfolio is split into three equal tranches. One-third is rebalanced each week, rotating through the offsets. Over three weeks, the full portfolio is still updated, just in smaller, smoother steps. This helps reduce sensitivity to any single day’s noise.
Rebalancing Day Does Matter
Here’s the cumulative return of the 15 full-rebalance variants:
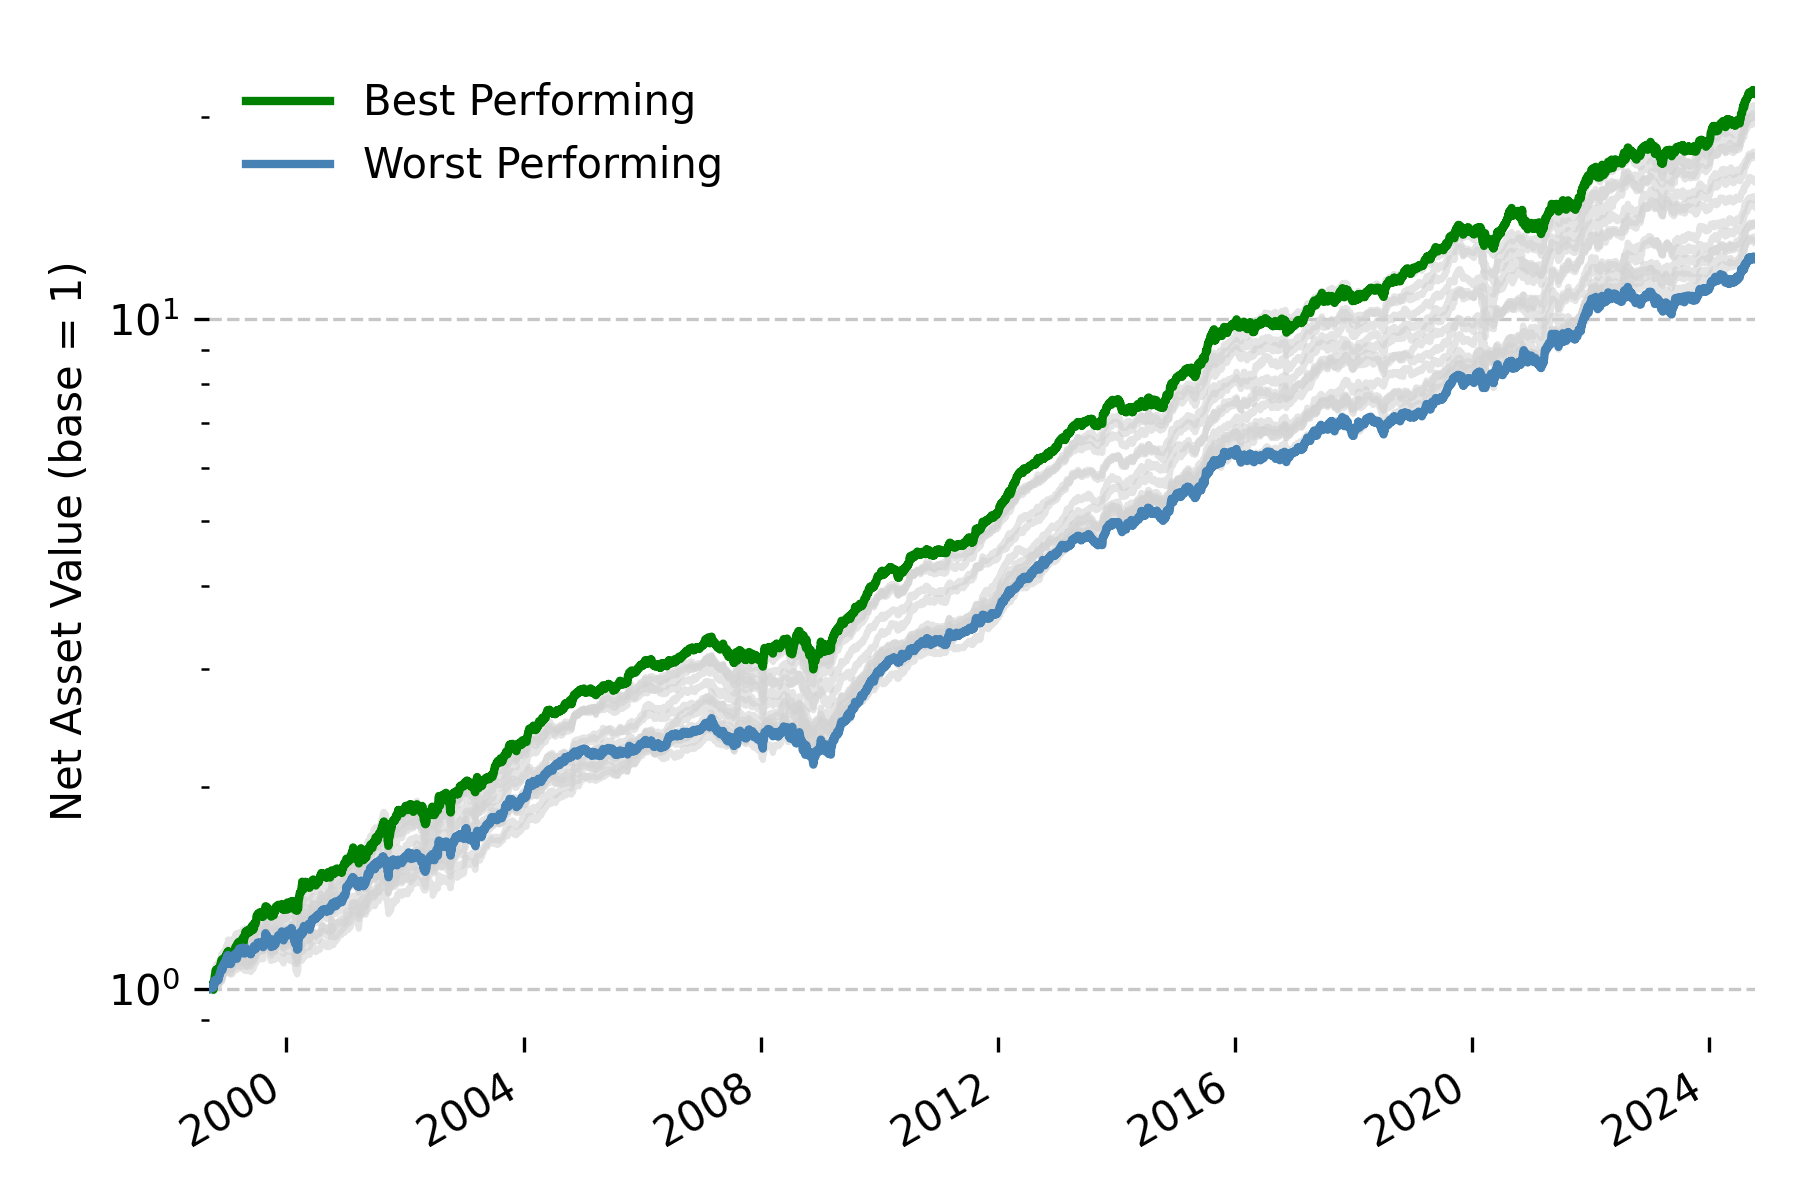
Figure 1: Cumulative returns for each rebalancing schedule (15 variants).
And the table of results:
| Tranche | Geometric Return | Volatility | Sharpe Ratio | Max Drawdown | Time Underwater |
|---|---|---|---|---|---|
| offset=0, day=1 | 10.38% | 6.58% | 1.53 | 12.41% | 548 days |
| offset=0, day=2 | 10.10% | 6.54% | 1.50 | 14.77% | 573 days |
| offset=0, day=3 | 10.61% | 6.54% | 1.57 | 13.79% | 582 days |
| offset=0, day=4 | 12.10% | 6.73% | 1.73 | 13.19% | 548 days |
| offset=0, day=5 | 12.17% | 6.91% | 1.70 | 13.59% | 369 days |
| offset=1, day=1 | 12.53% | 6.90% | 1.75 | 12.35% | 360 days |
| offset=1, day=2 | 12.21% | 6.97% | 1.69 | 12.13% | 387 days |
| offset=1, day=3 | 12.30% | 6.87% | 1.72 | 10.70% | 375 days |
| offset=1, day=4 | 11.64% | 6.70% | 1.68 | 12.72% | 360 days |
| offset=1, day=5 | 11.62% | 6.76% | 1.66 | 14.76% | 298 days |
| offset=2, day=1 | 10.90% | 6.50% | 1.67 | 11.38% | 248 days |
| offset=2, day=2 | 11.27% | 6.60% | 1.56 | 12.56% | 331 days |
| offset=2, day=3 | 10.61% | 6.60% | 1.63 | 11.01% | 275 days |
| offset=2, day=4 | 10.99% | 6.53% | 1.63 | 13.10% | 352 days |
| offset=2, day=5 | 10.37% | 6.45% | 1.56 | 13.10% | 593 days |
| Mean | 11.32% | 6.68% | 1.64 | 12.77% | 413 days |
Table 1: Performance metrics for each full-rebalance variant.
I was actually surprised by how much divergence there was. Even though all variants follow the same model, returns varied quite a bit, from around 10.1% to 12.5% annually. Sharpe ratios ranged from 1.50 to 1.75, and some variants spent hundreds of days longer in drawdown than others. These are meaningful differences for something as simple as shifting the rebalance day.
None of this comes from the model or the signal. It’s purely due to small shifts in rebalance timing that compound over time. Even when overall performance looks stable, this kind of noise makes it harder to tell whether a change is genuinely better or just lucky on timing.
Tranching: A Simple, Effective Fix
Instead of picking a single rebalancing day, we can average across them.
In the tranching setup, I split the portfolio into three equal parts. Each week, I rebalance one-third of the portfolio, always on the same weekday (say, every Wednesday), but each tranche follows a different offset within the three-week cycle. So over three weeks, the full portfolio is refreshed, just not all at once.
This staggered execution spreads risk more evenly across time without changing the model or signals.
To analyze the results, I group performance by weekday and average across the three offsets. This gives a cleaner comparison to the previous “all-at-once” setup.
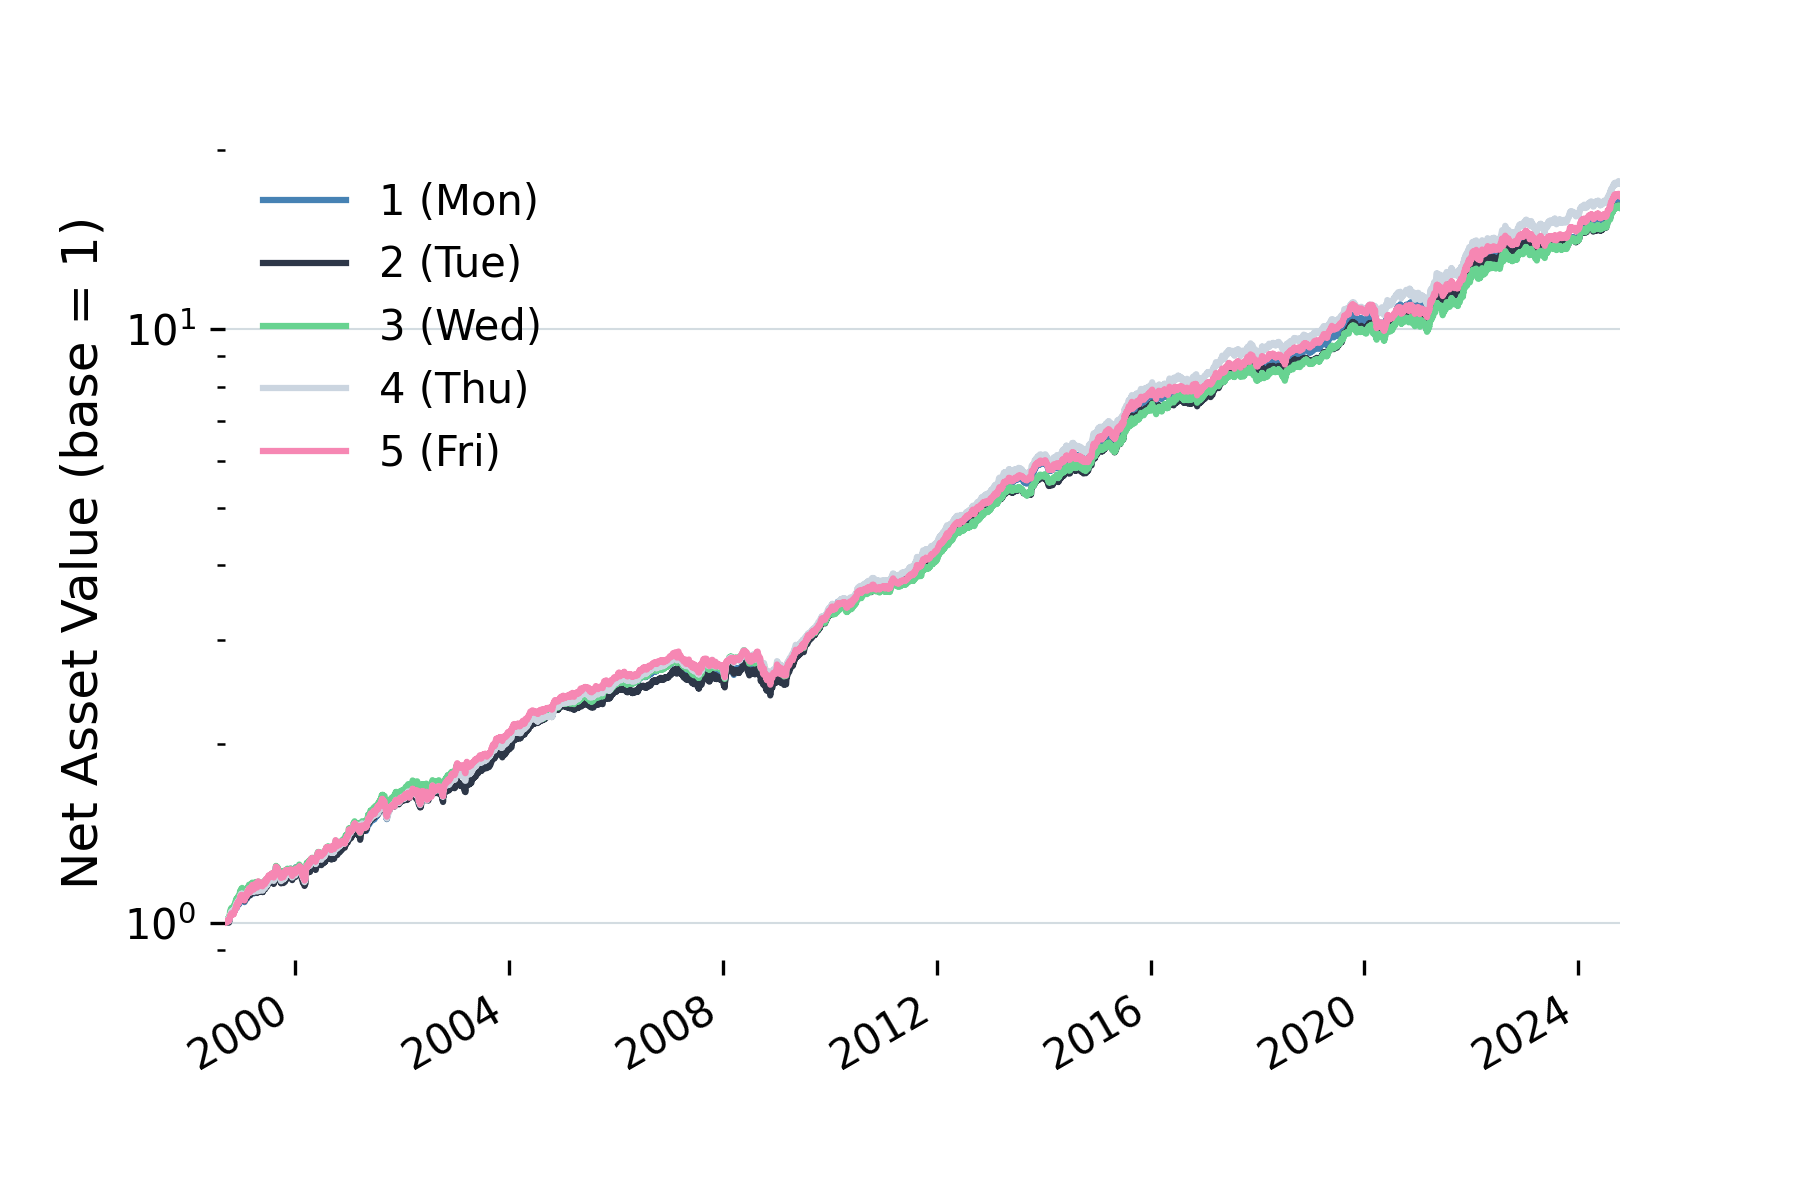
Figure 2: Cumulative returns with tranching by weekday (averaged over offsets).
| Weekday | Geometric Return | Volatility | Sharpe Ratio | Max Drawdown | Time Underwater |
|---|---|---|---|---|---|
| 1 (Mon) | 11.32% | 6.08% | 1.80 | 11.08% | 370 days |
| 2 (Tue) | 11.23% | 6.04% | 1.79 | 11.63% | 301 days |
| 3 (Wed) | 11.24% | 6.08% | 1.78 | 11.89% | 299 days |
| 4 (Thu) | 11.63% | 6.06% | 1.85 | 11.01% | 303 days |
| 5 (Fri) | 11.43% | 6.11% | 1.80 | 12.37% | 364 days |
| Mean | 11.37% | 6.07% | 1.80 | 11.60% | 327 days |
Table 2: Tranche-averaged performance by weekday.
Comparing the means tells the story clearly: average return is essentially unchanged (11.32% to 11.37%), but volatility drops from 6.68% to 6.07%, max drawdown improves from 12.77% to 11.60%, and Sharpe ratio rises from 1.64 to 1.80. Time underwater falls by nearly 90 days.
The key insight: tranching doesn’t generate extra return. It delivers the same return with less risk. By spreading rebalances across time, you smooth out the noise from any single day’s conditions. The cumulative return chart makes this visible: the lines almost sit on top of each other, which wasn’t the case before.
From a research perspective, this matters a lot. It cuts down the randomness from timing luck, making it easier to tell whether a model change is actually improving things or just benefiting from better timing.
There’s also a subtle benefit on the signal side: with tranching, you fold in new predictions each week instead of once every three weeks. That introduces a kind of temporal diversification and makes the strategy more responsive to new information.
Trade-Offs
Tranching isn’t free. Weekly rebalancing means running the pipeline more often, sending more orders, and keeping an eye on execution regularly. That adds overhead, especially when some trades are small.
Whether it’s worth it depends on your size. Zarattini & Pagani (2025) show that tranching’s benefits are AUM-dependent. For smaller portfolios, the increased number of trades can hurt since minimum commissions eat into those smaller positions. For larger portfolios, spreading trades over time reduces market impact, which matters more than the extra commission costs. Turnover itself stays roughly the same either way; what changes is how that turnover is distributed. Their paper provides a framework for finding the optimal number of tranches given your AUM.
Conclusion
What started as a small curiosity around rebalancing schedules turned into a strong case for using tranching by default. The results are cleaner and more stable, which is especially helpful when evaluating model tweaks.
I’ll be using this setup going forward for any strategy that rebalances on a fixed cycle. It’s simple, effective, and makes the whole process easier to trust.
References
- Rebalance Timing Luck - Newfound Research
- Rebalance Timing Luck and GTAA Portfolios - C. Zarattini, A. Pagani (2025)
- The Tranching Dilemma - C. Zarattini, A. Pagani (2025)